|
Communicating Risk for Sex Offenders: Risk Ratios for Static-2002R
Kelly M. Babchishin, R. Karl Hanson, Leslie Helmus
Public Safety Canada
[Sexual Offender Treatment, Volume 7 (2012), Issue 2]
Abstract
Aim/Background. Actuarial risk tools are commonly used in corrections and forensic mental health settings. Given their widespread use, it is important that evaluators and decision-makers understand how scores on these tools relate to recidivism risk. Relative risk is one useful metric for communicating an offender's risk of reoffending.
Methods. In the current study, risk ratios were computed for Static-2002R scores using 3 Canadian samples (N = 1,452 sex offenders).
Results. Each increase in Static-2002R score was associated with a stable and consistent increase in relative risk (as measured by an odds ratio or hazard ratio of approximately 1.4) and this increase was stable across time. Hazard ratios from Cox regression were used to calculate risk ratios that can be reported for Static-2002R.
Conclusion. We recommend that evaluators and treatment providers consider risk ratios as a useful, non-arbitrary metric for quantifying and communicating risk information.
Key words: risk ratios, relative risk, Static-2002R, sex offenders, risk communication
Communicating an individual's risk of reoffending is an essential task for corrections and forensic mental health professionals. To evaluate the risk for crime and violence in these settings, actuarial risk tools are often utilized (Otto & Douglas, 2010). Consequently, it is important to be able to correctly interpret and effectively communicate the information provided by these actuarial risk tools. Risk communication can involve various formats, such as nominal category (e.g., Offender B is at a "moderate" risk of reoffending) and numerical formats (e.g., offenders with the same score as Offender B reoffend at a rate of 30% after 5 years). Importantly, numerical formats lead to fewer interpretation errors compared to nominal formats (see Babchishin & Hanson, 2009, for a review). There are several numerical indicators that can be used for communicating an offender's risk of recidivism, including absolute recidivism rates (Helmus, Hanson, Thornton, Babchishin, & Harris, 2012), percentiles (Hanson, Lloyd, Helmus, & Thornton, 2012), and risk ratios (Hanson, Babchishin, Helmus, & Thornton, in press); each of these numerical formats has their strengths and weaknesses.
Numerical Indicators for Risk Communication
Absolute recidivism rates (e.g., "50% of offenders with a score of 10 are reconvicted within 5 years") are important for certain decisions requiring some estimate or approximation of absolute risk, such as civil commitment evaluations, (e.g., "more likely than not," "significant probability"). However, absolute recidivism rates may not be the most fundamental information provided by actuarial risk tools (Hanson et al., in press). Furthermore, these rates are hard to estimate due to the variability of reoffending rates across samples (Helmus, Hanson, et al., 2012; Hanson, Helmus, & Thornton, 2010). Risk tools are not meant to be exhaustive and risk factors external to the risk tool will influence an offender's observed recidivism rates.
Percentile ranks, a commonly used metric in psychology, are another useful metric. Percentiles provide information on the "unusualness" of the assessment findings (Crawford & Garthwaite, 2009). In the context of risk assessment, percentiles allow evaluators to state that an offender with a score of 5 on Static-99R, for example, is in the top 15% in terms of risk for recidivism (Hanson et al., 2012). Such a statement is useful in certain contexts (e.g., resource allocation). However, the relationship between the distribution of scores and the likelihood of recidivism is often unknown, and is unlikely to be linear. This can create a problem if the purpose of the risk assessment is to determine risk of recidivism.
Another metric involves risk ratios, which index is the likelihood of a particular offender's risk of recidivism relative to that of other offenders. We argue that risk ratios are a more fundamental attribute of risk tools than both percentiles and absolute risk. Specifically, each one-unit increase on a risk tool is expected to be related to an increase in the "riskiness" of the offender. Risk ratios can thus be used to compare the results of different risk tools and to combine information from several risk tools into one overall judgement of risk (e.g., Babchishin, Hanson, & Helmus, 2012). Unlike absolute recidivism rates, risk ratios for the Static-99R and Static-2002R (two common risk tools for sex offenders) have not been found to vary between samples (Hanson et al., in press; Helmus, Hanson, et al., 2012), thus allowing for easier communication of recidivism risk.
The purpose of the current study was to develop risk ratios for Static-2002R (Hanson & Thornton, 2003; Helmus, Thornton, Hanson, & Babchishin, 2012), the second most commonly used measure amongst sex offender treatment providers in Canada (McGrath, Cumming, Burchard, Zeoli, & Ellerby, 2010). Risk ratios for Static-99R have already been published (Hanson et al., in press). A secondary purpose of this study was to demonstrate how the techniques recommended in our development of Static-99R risk ratios (Hanson et al., in press) can be applied to a new risk scale.
In order to justify the use of risk ratios, the current study also examined the extent to which risk ratios were consistent across follow-up times and whether the measurement model implied in the calculation of risk ratios fit the available data. These assumptions were examined using three Canadian samples comprising an aggregated sample of 1,452 sex offenders. The offenders in these samples had not been preselected on risk relevant characteristics, and, consequently, represent relatively routine samples of sex offenders.
Methods
Measure
Static-2002R (Hanson & Thornton, 2003; Helmus, Thornton, et al., 2012). Static-2002R is a 14-item actuarial measure that assesses sexual recidivism risk of adult male sex offenders. It has 14 items grouped into 5 main subscales: age at release, persistence of sex offending, sexual deviance, relationship to victims, and general criminality. The total score (ranging from -2 to 14) can be used to place offenders in one of five risk categories: low (-2 to 2), low-moderate (3 to 4), moderate (5 to 6), moderate-high (7 to 8), and high (9+). The items are identical to Static-2002 with the exception of updated age weights (Helmus, Thornton, et al., 2012). Previous research found that Static-2002 was significantly more predictive of sexual, violent, and any recidivism than Static-99 (Hanson et al., 2010). In contrast, Static-99R and Static-2002R have similar predictive accuracy for sexual recidivism (Babchishin et al., 2012).
Samples
The 3 samples (N = 1,452) used in the current study were selected from a larger group of studies used for re-norming the Static-99 (Helmus, 2009). For this study, inclusion criteria were that Static-2002R data were needed, and the sample had to be considered "routine" (i.e., relatively unselected). Table 1 lists the descriptive information of the included samples.
Table 1: Background data of the
participants (N = 45) |
| Study |
Cox
Regression
N |
N5-year
(Logistic
Regression) |
Static-02R
M (SD) |
Recidivism
Criteria |
Follow-up
M (SD) |
Type
of Sample |
Mostly
Treated |
Release
Period |
Mdn
Year
Release |
| Bigras (2007) |
454 |
196 |
3.5 (2.5) |
Charges |
4.6 (1.9) |
Routine CSC |
Mixed |
1995-2004 |
1999 |
| Boer (2003) |
296 |
296 |
3.9 (2.7) |
Conviction |
13.3 (2.1) |
Routine CSC |
- |
1976-1994 |
1990 |
| Hanson et al. (2007) |
702 |
- |
3.5 (2.5) |
Charges |
3.5 (1.0) |
Routine Community supervision |
- |
2001-2005 |
2002 |
| Total |
1,452 |
492 |
3.6 (2.5) |
- |
5.8 (4.1) |
- |
- |
1976-2005 |
1997 |
| Note. CSC = Correctional Service Canada (administers all
sentences of at least two years). Average Static-2002R scores were computed
using the sample size from cox regression. Sample includes all cases available
for cox regression with sample as strata; three cases were deleted because
the total follow-up time was less than the time to first observed recidivism
event. Thirty-one cases from Hanson et al. (2007) were excluded from all
5-year analyses because there were no sexual recidivists in that group. |
Bigras (2007). The sample included 94% of all sex offenders receiving a federal sentence (two or more years) in Quebec between 1995 and 2000 (6% refused participation in the research or were unable to provide consent).
Boer (2003). The study examined all male federal offenders serving a federal sentence for a sex offence in British Columbia whose Warrant Expiry Date (WED; the end of their sentence) was between January 1990 and May 1994. Many offenders are granted conditional release prior to their WED; thus, offenders in this sample were released as early as 1976.
Hanson, Harris, Scott, & Helmus (2007). This prospective study followed offenders on community supervision between 2001-2005 in Canada, Alaska, and Iowa, although only Canadian offenders were used in the current study.
Data Analysis
The same procedures explained in Hanson et al. (in press) were used to compute risk ratios for the Static-2002R, examine the fit between the relative risk model and the data, and examine the extent to which the estimates were consistent across time. The analyses are explained briefly below, and interested readers are encouraged to refer to Hanson et al. (in press) for more information.
Risk ratios. Risk ratios can be defined using rate ratios, odds ratios, and hazard ratios. Rate ratios are the ratio of two probabilities (or rates), odds ratios are the ratio of two odds, and a hazard ratio is a ratio of two hazard rates. Hazard ratios are similar to rate ratios, but whereas rate ratios are restricted to a fixed-follow up period (e.g., at five years), hazard ratios provide an indicator of relative risk at any given point in time. A hazard ratio of 1.5, for example, can be interpreted to mean that this particular risk group has 1.5 times the rate of reoffending as offenders in the midpoint of the distribution, across the follow-up period.
Hazard ratios. Cox regression is the most widely used method of estimating hazard ratios from survival data (Singer & Willett, 2003, §14). More specifically, hazard functions assess the risk, at a particular moment, that individuals will fail if they have not already done so. A hazard ratio is the ratio of hazard functions for offenders with different scores, and provides information on a particular offender's risk relative to other offenders. The median Static-2002R score of 3 was used as the reference category (i.e., relative to what?). Using the median category allows hazard ratios to be interpreted as the extent to which a group is of a higher or lower risk than the middle (i.e., midpoint) of the risk distribution for sex offenders. Cox regression was used to estimate averaged hazard ratios, while controlling for differences in recidivism base rates and differences in the shape of the survival functions across samples by including sample as strata in the analyses. Hazard ratios for each score were computed as follows: eßxScore. Where ß is the Cox regression coefficient (i.e., the average log hazard ratio), and "score" is the score on the risk tool centered on its median (i.e., so a Static-2002R score of 3 is actually a score of 0 because it is the median).
Fit. Risk ratios can be computed using both logistic regression and Cox regression. Logistic regression (odds ratios) requires a fixed follow-up and, as such, is generally based on a smaller sample size than Cox regression, which does not require a fixed follow-up time. In addition, the interpretation of odds ratios is much more cumbersome than hazard ratios (computed via Cox regression). For example, an odds ratio of 1.5 can be interpreted to mean that the risk group has 1.5 times the odds of reoffending as offenders in the lower group, after a five-year follow-up. In contrast, Cox regression provides hazard ratios that are not constrained by a fixed follow-up time and describe the risk of recidivism as a rate rather than odds, which is simpler to interpret. Hanson et al. (in press) found that the model implied by Cox regression fit their data and, consequently, computed hazard ratios. The current study examined the fit between these two models and the data in order to justify which type of risk ratios (i.e., hazard ratios or odds ratios) to select for the Static-2002R.
Both of these models start with the assumption that relative risk increases by a fixed and equal amount for each one-unit increase in the predictor. The validity of this assumption was tested by examining whether a curve component improves the fit between observed and predicted values (change in deviance index χ2, defined as -2[Log Likelihood]). This is done by adding the square of the Static-2002R scores after entering the original scores in the regression model. In addition, the Hosmer and Lemeshow test (Bewick, Cheek, & Ball, 2005; Hosmer & Lemeshow, 2000) was used to assess the fit between the observed recidivism rates and the recidivism rates predicted by the logistic regression (logistic curve) and by Cox regression (exponential curve). A nonsignificant Hosmer and Lemeshow test suggests a good fit between the observed and expected recidivism rates. For logistic regression, the predicted values tested were those provided by the fitted logistic curve.
Though Cox regression is usually based on variable follow-up time, a fixed five-year follow-up was also used in order to allow for comparison to the logistic regression analyses. Cox regression does not directly produce recidivism rate estimates (only estimates of relative risk). As such, to compute the Hosmer and Lemeshow test, we needed to produce expected five-year recidivism rates. To compute the expected recidivism rates, we used the five-year sexual recidivism rate for a Static-2002R score of 3 (which was estimated from logistic regression) as the base rate. This base rate was then multiplied by the hazard ratios in Table 2 (discussed further below) to create the expected recidivism rate and the exponential function implied by the Cox regression analyses.
Stable Across Time. Schoenfeld residuals ( ) were used to formally examine if hazard rates were constant over time (i.e., the proportional hazards assumption in Cox regression; Singer & Willett, 2003). If the proportionality assumption is violated, Schoenfeld residuals will be correlated with time to recidivism.
Results
Does a Relative Risk Measurement Model Fit the Static-2002R?
The relative risk model in Cox regression implies that the shape of the function linking Static-2002R scores to recidivism should be approximately exponential (i.e., increase in scores are associated with the same proportional increase in recidivism rate) or, for the case of odds ratios derived from logistic regression analyses, the shape is assumed to be logistic (i.e., a "S" shaped curve based on logits or log odds).
Logistic regression was used to formally test how well the relationship between Static-2002R and fixed five-year sexual recidivism fit a logistic function (n = 492). The Static-2002R model had a B1 of .405 (SE = .091) and a B0 of -3.60 (SE = .329). These parameters translate to an average odds ratio of 1.50 (95% CI [1.26, 1.79]) and a recidivism base rate of 2.65% (95% CI [1.41, 4.92]) for a Static-2002R score of 3. The Hosmer and Lemeshow test was nonsignificant (χ2 = 1.95, df = 6, p = .924) and allowing a curve component did not significantly improve the model (χ2 change = 0.63, df = 1, p = .426), indicating a good fit between the data and the logistic curve.
Cox regression was then used to formally test how well the relationship between Static-2002R and sexual recidivism fit an exponential function. The Static-2002R model based on all cases (using all follow-up data; k = 3, n = 1,452 using sample as strata) had a ß of .322 (SE = .038), which translates to an average hazard ratio of 1.38 (95% CI [1.28, 1.48]). Allowing a curve component did not significantly improve the model, χ2 change = 0.94, df = 1, p = .333. Restricting the cox regression analysis to the same 5-year period as the logistic regression analysis, the Static-2002R model had a ß of .422 (SE = .083), which translates to an average hazard ratio of 1.52 (95% CI [1.30, 1.80], N = 492). Allowing a curve component did not significantly improve the model (χ2 change = 0.91, df = 1, p = .339) and the Hosmer and Lemeshow test was non-significant (χ2 = 3.09 df = 6, p = .798), indicating good fit between the data and the exponential function.
Figure 1 displays the observed five-year sexual recidivism rates plotted along with the five-year sexual recidivism rates derived from logistic and Cox regression analyses. The logistic and exponential fitted curves were virtually identical between Static-2002R scores of -2 and 7, which is expected given the similarity in regression coefficients (0.405 and 0.422) and the relatively low base rates. For the very highest scores (8 or more), the exponential curve estimated slightly higher values than did the logistic curve. In short, both of these relative risk estimates (odds ratios in logistic regression, and hazard ratios in Cox regression) fit the data and are defensible indices of relative risk.
 | 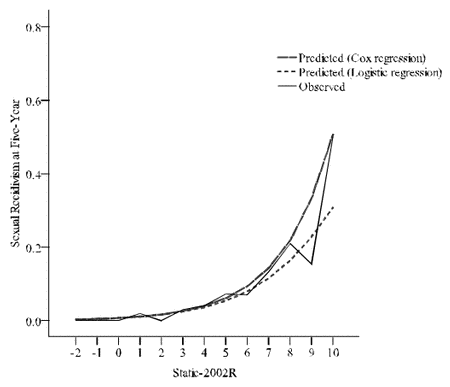
| Figure 1: Observed five-year sexual recidivism rates plotted along with the five-year sexual recidivism rates derived from logistic and cox regression analyses. Static-2002R scores of 11 were not displayed because of small cell size (n = 1). |
Relative Risk is Stable across Time
Schoenfeld residuals were used to formally test the proportional hazards assumption in Cox regression (i.e., that the hazard ratios are constant over time; Singer & Willett, 2003). As can be seen in Figure 2, no observable patterns emerged, and the correlation with time was not significant (r = -.097; n = 112, p = .310).
| 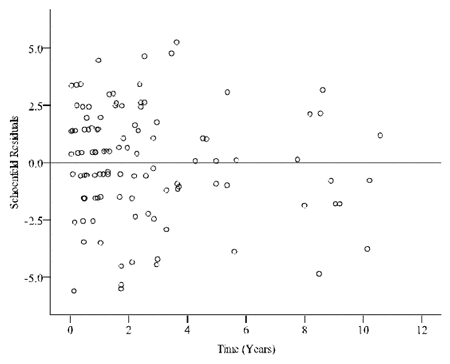
| Figure 2: Schoenfeld residuals plotted as a function of time. No observable relationship indicates that the hazard rates are stable across time. |
Computing Risk Ratios
Given that the exponential model fit the data and hazard rates were stable across time, risk ratios were computed based on hazard ratios. The Cox regression hazard ratio estimates for the full dataset, with sample as strata, was privileged over the logistic regression model because it was based on the largest sample size and allows for simpler risk communication compared to odds ratios. The final hazard ratios for each score of Static-2002R are presented in Table 2.
The median Static-2002R (score of 3) was used as the reference category and, thus, has a risk ratio of 1; a risk ratio of 1 means that offenders with that score have the same rate of reoffending as offenders with the median score on the Static-2002R. Recall that the hazard ratio for each score is the exponent of the ß multiplied by the centered score, or eß*(Score-Reference Score). For Static-2002R, the log hazard ratio (ß) is .322, and the exponent of the log hazard ratio is 1.38. This formula can be simplified as 1.38(Score-Reference Score). For example, a score of 4 was one unit higher than a score of 2, so (1.38)1 = 1.38. For a score of 5, which is two units above the reference category, the hazard ratio was calculated as (1.38)2 or (1.38)*(1.38) = 1.90. When scores were lower than the reference category, then hazard ratios are calculated by dividing 1 by 1.38 raised to the power of the score minus the reference category, or 1/1.38(Score-Reference Score). For example, the hazard ratio for a score of 0 (3 units below the reference category) was 1/1.383 or 1/[(1.38)*(1.38)*(1.38)] = 0.38.
As can be seen in Table 2, sex offenders with a Static-2002R score of 1 reoffended at about half the rate of sex offenders with a score in the middle (midpoint) of the risk distribution. Sex offenders with a Static-2002R score of 5 reoffended at about twice the rate of offenders at the midpoint and sex offenders with a Static-2002R score of 8 reoffended at about five times the rate of the midpoint.
Table 2: Hazard Ratios for Static-2002R |
Static-2002R
Score |
Sexual
Recidivism |
Frequency
(n) |
Hazard
Ratio |
-2 |
30 |
0.20 |
-1 |
36 |
0.28 |
0 |
102 |
0.38 |
1 |
135 |
0.52 |
2 |
192 |
0.72 |
3 |
221 |
1.00 |
4 |
220 |
1.38 |
5 |
195 |
1.90 |
6 |
137 |
2.63 |
7 |
88 |
3.62 |
8 |
45 |
5.00 |
9+ |
51 |
6.90 |
Note. For sexual recidivism, hazard ratios based on Cox
regression coefficients derived from entering the raw static-
2002R scores (ß = 0.322; SE = .038), with sample
as
strata (k = 3, n = 1,452). Three cases were deleted
because the total follow-up time was less than the time to
first observed recidivism event. Due to small sample size,
score of 9 and higher were combined into one category. |
Discussion
Forensic evaluators and decision-makers prefer using nominal categories when thinking and talking about an offender's risk (Grann & Pallvic, 2002). However, we commonly disagree about what "low," "moderate," and "high" risk actually represent (e.g., Hilton, Carter, Harris, & Sharpe, 2008; Monahan & Silver, 2003). Numerical risk communication (e.g., percentiles, recidivism estimates, and risk ratios) leads to fewer interpretation errors compared to nominal risk categories (e.g., Karelitz & Budescu, 2004). One way for users of risk tools to continue using nominal categories is to link these nominal terms to non-arbitrary numerical definitions of risk. For example, when an evaluator says "Offender X is high risk of sexual reoffending," it could mean "offenders with the same score as Offender x are twice as likely to sexually reoffend compared to offenders with a median score." With nominal categories defined using numerical indicators, evaluators and decision-makers can use these nominal categories with a common definition (see Babchishin & Hanson, 2009, for further discussion). Risk ratios are one useful definition of risk. Based on 3 routine samples (N = 1,452), the observed recidivism rates could be well represented by a statistical model in which a one-unit increase in Static-2002R score indicates an increase in sexual recidivism risk of approximately 1.4, and this rate of increase in relative risk was consistent across the time periods.
Practical Implications
Treatment programs are most effective when following the principles of risk, need, and responsivity (RNR; Andrews, Bonta, & Hoge, 1990; Bonta & Andrews, 2007; Hanson, Bourgon, Helmus, & Hodgson, 2009). Specifically, treatments are most effective when they match treatment intensity to the risk level of the offenders (risk principle), target characteristics that are related to reoffending (needs principle), and match treatment to the offenders' learning styles and abilities (responsivity principle). Risk ratios can be useful in informing decisions concerning matching the intensity of interventions to the degree of riskiness (e.g., matching the length of treatment to initial risk levels). An advantage of utilizing risk ratios is that if different treatment settings use different risk scales, risk tools can be compared on their risk ratios, thereby allowing standardization of the decision threshold (e.g., any offender who is twice as likely to reoffend than the midpoint score will be referred to treatment). This is not possible when using predetermined scores on risk scales.
As aforementioned, risk ratios are well suited to quantifying and comparing the results of different risk scales. Evaluators often use different risk tools (Jackson & Hess, 2007) and risk tools do not always provide the same results (Barbaree, Langton, & Peacock, 2006). Risk ratios can be used to combine the information contained in different risk tools into an overall judgement of risk (Babchishin et al., 2012; Lehmann et al., 2012). Risk scale developers should provide risk ratios for their scales in order to facilitate risk communication and allow users of risk tools to combine several risk scales into one overall judgement of risk (see Babchishin et al., 2012 and Lehmann et al., 2012, for application).
For current users of Static-2002R, the risk ratios presented in the current study can be used in applied assessments to improve risk communication. Using Table 2, an offender with a Static-2002R score of 1, for example, could be described as being a member of a group whose expected rate of sexual recidivism is approximately half that of sex offenders at the midpoint of the risk distribution (defined as a median score of 3). However, risk ratios can be misinterpreted in the absence of base rates. Specifically, risk ratios result in overestimation of risk when base rates are ignored (Elmore & Gigerenzer, 2005) and, therefore, risk ratios should be presented with recidivism base rates. We would have vastly different interpretations of risk if a sample has a base rate of 3.5% or a base rate of 35%. In the latter case, an offender that is twice as likely to reoffend than the midpoint seems particularly risky (i.e., estimated recidivism rate of 7% vs. 70%).
The risk ratios presented in the current study were developed on samples that had not been preselected on risk relevant characteristics, and, consequently, represent relatively routine samples of sex offenders. The generalizability of these risk ratios to non-routine samples has not been established. In particular, both theory and preliminary analyses suggest that a consistent exponential distribution is unlikely to represent the recidivism data well when a substantial portion (>10%) of the sample have expected recidivism rates of greater than 50% (e.g., predicting violent recidivism among offenders preselected as high risk).
Evaluators should also not assume that the risk ratios observed in the current study are identical for all types of recidivism (i.e., a risk ratio of 2.0 does not mean the offender is twice as likely to reoffend than the midpoint for both sexual and general recidivism). To the extent that different risk factors predict different types of outcomes, then variation in the Static-2002R risk ratios would be expected for different recidivism criteria (e.g., violent recidivism, any recidivism).
Conclusion
In general, the selection of numerical indicators for nominal risk categories should be linked to the decisions at hand. The current study provides risk ratios for Static-2002R that can be used in applied settings. Risk communication improves when information is provided in multiple forms (Karelitz & Budescu, 2004); as such, we encourage evaluators using the STATIC risk instruments to present three different quantitative indicators: absolute recidivism rates, percentiles, and risk ratios (see templates available at  www.static99.org). However, given that percentiles and risk ratios are not commonly used in applied risk assessments for sex offenders, evaluators using these indicators need to exercise special care so that these metrics are properly understood by the intended audiences. www.static99.org). However, given that percentiles and risk ratios are not commonly used in applied risk assessments for sex offenders, evaluators using these indicators need to exercise special care so that these metrics are properly understood by the intended audiences.
Author note
The views expressed are those of the authors and not necessarily those of Public Safety Canada. Thank you to Jacques Bigras and Sasha Boer for granting us permission to use their data and for being patient with our ongoing questions.
References- Andrews, D. A., Bonta, J., & Hoge, R. D. (1990). Classification for effective rehabilitation: Rediscovering psychology. Criminal Justice and Behavior, 17, 19-52.
- Bonta, J., & Andrews, D. A. (2007). Risk-need-responsivity model for offender assessment and rehabilitation (Corrections Research User Report No. 2007-06). Ottawa, Ontario: Public Safety Canada.
- Babchishin, K. M., & Hanson, R. K. (2009). Improving our talk: Moving beyond the low, moderate, and high typology of risk communication. Crime Scene, 16(1), 11-14. Available at http://www.cpa.ca/cpasite/userfiles/Documents/Criminal%20Justice/Crime%20Scene%202009-05(1).pdf
- Babchishin, K. M., Hanson, R. K., & Helmus, L. (2012). Even highly correlated measure can add incrementally to predicting recidivism among sex offenders. Assessment. Advanced online publication. doi:10.1177/1073191112458312
- Barbaree, H. E., Langton, C. M., & Peacock, E. J. (2006). Different actuarial risk measures produce different risk rankings for sexual offenders. Sexual Abuse: A Journal of Research and Treatment, 18, 423440. doi:10.1007/s11194-006-9029-9
- Bewick, V., Cheek, L., & Ball, J. (2005). Statistical review 14: Logistic regression. Critical Care, 9, 112-118. doi:10.1186/cc3045
- Bigras, J. (2007). La prédiction de la récidive chez les délinquants sexuels [Prediction of recidivism among sex offenders]. Dissertations Abstracts International, 68 (09). (UMI No. NR30941).
- Boer, A. (2003). Evaluating the Static-99 and Static-2002 risk scales using Canadian sexual offenders. Unpublished masters thesis, University of Leicester, Leicester, United Kingdom.
- Crawford, J. R., & Garthwaite, P. H. (2009). Percentiles please: The case for expressing neuropsychological test scores and accompanying confidence limits as percentile ranks. The Clinical Neuropsychologist, 23, 193-204. doi:10.1080/13854040801968450
- Elmore, J. G., & Gigerenzer, G. (2005). Benign breast disease: The risk of communicating risk. The New England Journal of Medicine, 353, 297-299. doi:10.1056/NEJMe058111
- Grann, M., & Pallvik, A. (2002). An empirical investigation of written risk communication in forensic psychiatric evaluations. Psychology, Crime & Law, 8, 113-130. doi:10.1080/10683160208401812
- Hanson, R. K., Babchishin, K. M., Helmus, L., & Thornton, D. (in press). Quantifying the Relative Risk of Sex Offenders: Risk Ratios for Static-99R. Sexual Abuse: A Journal of Research and Treatment.
- Hanson, R. K, Bourgon, G., Helmus, L, & Hodgson, S. (2009). The principles of effective correctional treatment also apply to sexual offenders. Criminal Justice and Behavior, 36, 865-891. doi:10.1177/0093854809338545
- Hanson, R. K., Harris, A. J. R., Scott, T., & Helmus, L. (2007). Assessing the risk of sexual offenders on community supervision: The Dynamic Supervision Project (Corrections Research User Report No. 2007-05). Ottawa, Canada: Public Safety Canada.
- Hanson, R. K., Helmus, L., & Thornton, D. (2010). Predicting recidivism among sexual offenders: A multi-site study of Static-2002. Law and Human Behavior, 34, 198-211. doi:10.1007/s10979-009-9180-1
- Hanson, R. K., Lloyd, C. D., Helmus, L., & Thornton, D. (2012). Developing non-arbitrary metrics for risk communication: Percentile ranks for the Static-99/R and Static-2002/R sexual offender risk tools. International Journal of Forensic Mental Health, 11, 9-23. doi:10.1080/14999013.2012.667511
- Hanson, R. K., & Thornton, D. (2003). Notes on the development of Static-2002. (Corrections Research User Report No. 2003-01). Ottawa, Canada: Department of the Solicitor General of Canada.
- Helmus, L. (2009). Re-norming Static-99 recidivism estimates: Exploring base rate variability across sex offender samples (masters thesis). Available from ProQuest Dissertations and Theses database. (UMI No. MR58443). Also available from www.static99.org
- Helmus, L., Hanson, R. K., Thornton, D., Babchishin, K. M., Harris, A. J. R. (2012). Absolute recidivism rates predicted by Static-99R and Static-2002R sex offender risk assessment tools vary across samples: A meta-analysis. Criminal Justice and Behavior. 33, 1148-1171. doi:10.1177/0093854812443648
- Helmus, L., Thornton, D., Hanson, R. K., & Babchishin, K. M. (2012). Improving the predictive accuracy of Static-99 and Static-2002 with older sex offenders: Revised age weights. Sexual Abuse: Journal of Research and Treatment, 24, 64-101. doi:10.1177/1079063211409951
- Hilton, N. Z., Carter, A., Harris, G. T., Sharpe, A. J. B. (2008). Does using nonumerical terms to describe risk aid violence risk communication? Journal of Interpersonal Violence, 23, 171-188. doi:10.1177/0886260507309337
- Hosmer, D. W., & Lemeshow, S. (2000). Applied logistic regression (2nd ed.). New York: Wiley.
- Jackson, R. L., & Hess, D. T. (2007). Evaluation for civil commitment of sex offenders: A survey of experts. Sexual Abuse: A Journal of Research and Treatment, 19, 409-448. doi:10.1007/s11194-007-9062-3
- Karelitz, T. M., & Budescu, D. V. (2004) .You say probable and I say likely: Improving interpersonal communication with verbal probability phrases. Journal of Experimental Psychology, 10, 25-41. doi:10.1037/1076-898X.10.1.25
- Lehmann, R. J. B., Hanson, R. K., Babchishin, K. M., Gallasch-Nemitz, F., Biedermann, J., Dahle, K. -P. (2012). Interpreting multiple scales for sex offenders: Evidence for averaging. Unpublished Manuscript.
- McGrath, R. J., Cumming, G. F., Burchard, B. L., Zeoli, S., & Ellerby, L. (2010). Current practices and emerging trends in sexual abuser management: The Safer Society 2009 North American survey. Brandon, VT: Safer Society Foundation.
- Monahan, J., & Silver, E. (2003). Judicial decision thresholds for violence risk management. International Journal for Forensic Mental Health, 2, 1-6. doi:10.1080/14999013.2003.10471174
- Otto, R. K., & Douglas, K. S. (Eds). Handbook of violence risk assessment. New York: Routledge Taylor and Francis Group.
- Singer, J. D., & Willett, J. B. (2003). Applied longitudinal data analysis: Modeling change and even occurrence. New York: Oxford University Press.
Author address
Kelly Babchishin
Corrections Research
Public Safety Canada
340 Laurier Avenue West
Ottawa, ON, Canada, K1A 0P8
Kelly.Babchishin@ps.gc.ca
|